HELP AGAIN
Male and female high school students reported how many hours they worked each week...

Mathematics, 03.05.2020 13:58 mommytobe2019
HELP AGAIN
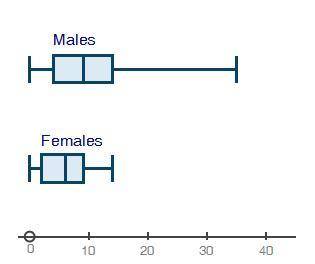
Male and female high school students reported how many hours they worked each week in summer jobs. The data is represented in the following box plots:
two box plots shown. The top one is labeled Males. Minimum at 0, Q1 at 3, median at 10, Q3 at 15, maximum at 35. The bottom box plot is labeled Females. Minimum at 0, Q1 at 2, median at 6, Q3 at 9, maximum at 14
Identify any values of data that might affect the statistical measures of spread and center. (2 points)
Group of answer choices
The zero hour mark on both plots prevents the graphs from being balanced.
The median is near the center of the IQR for both males and females.
There is not enough evidence to see any effects on spread or center.
The males have a suspected significant high outlier.

Answers: 1


Other questions on the subject: Mathematics
Mathematics, 21.06.2019 21:00, cinthyafleitas
What number line represents the solution set for the inequality -1/2 greater than or equal to 4
Answers: 1
You know the right answer?
Questions in other subjects:

Mathematics, 30.09.2020 01:01
History, 30.09.2020 01:01

Biology, 30.09.2020 01:01


Geography, 30.09.2020 01:01
Mathematics, 30.09.2020 01:01


