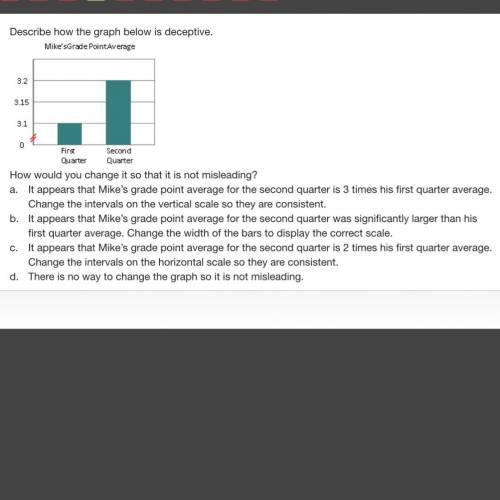
Describe how the graph below is deceptive.
How would you change it so that it is not mi...

Mathematics, 05.05.2020 00:18 austintules2005
Describe how the graph below is deceptive.
How would you change it so that it is not misleading?
a.
It appears that Mike’s grade point average for the second quarter is 3 times his first quarter average. Change the intervals on the vertical scale so they are consistent.
b.
It appears that Mike’s grade point average for the second quarter was significantly larger than his first quarter average. Change the width of the bars to display the correct scale.
c.
It appears that Mike’s grade point average for the second quarter is 2 times his first quarter average. Change the intervals on the horizontal scale so they are consistent.
d.
There is no way to change the graph so it is not misleading.

Answers: 2


Other questions on the subject: Mathematics
Mathematics, 21.06.2019 22:30, bobyjoetato4599
The area of the map is the product of the length and width. write and expression for the area as the product of the two binomials do not multiply
Answers: 2
Mathematics, 21.06.2019 23:00, bustillojoshua4
According to the general equation for conditional probability if p(anb)=3/7 and p(b)=7/8 what is p(a i b)
Answers: 1
You know the right answer?
Questions in other subjects:


Business, 13.01.2020 21:31
Business, 13.01.2020 21:31


Biology, 13.01.2020 21:31
Biology, 13.01.2020 21:31


