The scatter plot shows the sizes and annual rents of some office
spaces in the downtown area o...

Mathematics, 05.05.2020 01:08 PrincesaChrissy6366
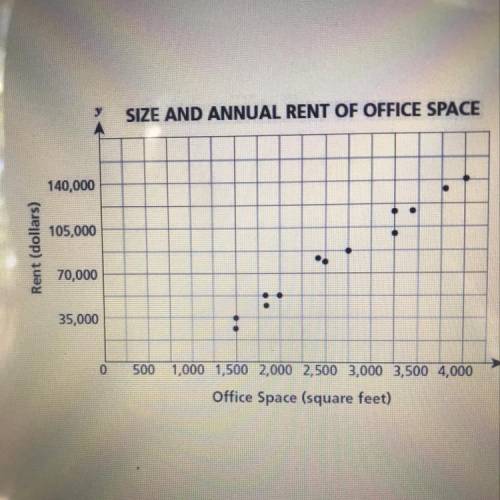
The scatter plot shows the sizes and annual rents of some office
spaces in the downtown area of a city. What would the line of best fit
reveal about these data?
a. There is a weak positive relationship between the cost of rent and the size of the office space
b. There is a weak negative relationship between the cost of rent and the size of the
office space
c. There is a strong positive relationship between the cost of rent and the size of the
office space
d. There is a strong negative relationship between the cost of rent and the size of
the office space

Answers: 3


Other questions on the subject: Mathematics
Mathematics, 22.06.2019 00:00, keshjdjsjs
The graph shows the decibel measure for sounds depending on how many times as intense they are as the threshold of sound. noise in a quiet room is 500 times as intense as the threshold of sound. what is the decibel measurement for the quiet room? 20 decibels28 decibels200 decibels280 decibels
Answers: 1
Mathematics, 22.06.2019 01:00, franklinkaylieg3873
What are the solutions for the following system? -2x^2+y=-5 y=-3x^2+5
Answers: 3
Mathematics, 22.06.2019 03:30, live4dramaoy0yf9
Which polynomial is in standard form? 3xy+6x®y2 - 4x4y + 19x? y* 18x5 - 7x{y-2xy2 + 1774 x5y5 - 3xy - 11x? y2 +12 15+ 12xy2 - 11x®ys +5x? y2 ?
Answers: 1
You know the right answer?
Questions in other subjects:
Mathematics, 26.10.2021 17:50

English, 26.10.2021 17:50

History, 26.10.2021 17:50
History, 26.10.2021 17:50


Chemistry, 26.10.2021 17:50


