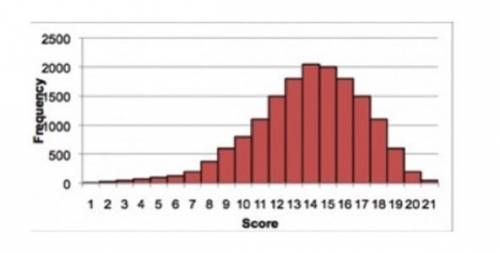
The histogram below is the data from the 2017 FSA Readiness Assessment taken by sixth graders.
...

Mathematics, 05.05.2020 03:31 victoria6929
The histogram below is the data from the 2017 FSA Readiness Assessment taken by sixth graders.
Use the distribution to determine which answer choices are true or false. SELECT ALL THAT APPLY.
A) The distrubition ranges between scores of 1 and 21.
B) The distribution has a peak at a score of 14.
C) The distribution shows teh data is skewed to the right.
D) The distribution does not have a cluster between 1 and 2.
E) The distribution shows a total of 4000sixth graders scored either a 12 or 14.

Answers: 3


Other questions on the subject: Mathematics
Mathematics, 21.06.2019 14:00, tasha7121
9. (y^-5)^10y^10 a. y^-60 b. y^60 c. y^-150 d. y^150 find the simplified form of each expression. 10. (4/7^5)^2 a.8/14^10 b.16/49^25 c.16/49y^10 d.8/14y^25 11. determine if the number 3.43 times 10^-6 is written in scientific notation. if not, explain. a. yes; the number is written scientific notation. b. no; the first factor is not a number between 1 and 10. c. no; it is not written as a number times a power of 10
Answers: 3
Mathematics, 21.06.2019 14:00, aambert7256
You purchased 8 pounds 10 ounces of candy from a candy shop. you want to split it equally among 3 classrooms at a local school.
Answers: 1
Mathematics, 21.06.2019 18:00, edgarsandoval60
What is the equation of this graphed line? enter your answer in slope-intercept form in the box.
Answers: 2
You know the right answer?
Questions in other subjects:


Business, 20.10.2020 20:01
Mathematics, 20.10.2020 20:01


English, 20.10.2020 20:01
English, 20.10.2020 20:01


