
Mathematics, 05.05.2020 05:06 lilxjayyy
The dot plots below show the scores for a group of students for two rounds of a quiz: Two dot plots are shown one below the other. The title for the dot plot on the top is Round 1 and the title for the bottom plot is Round 2. Below the line for each dot plot is written Score. There are markings from 1 to 5 on the line at intervals of one. There are 2 dots above the mark 2, there are 3 dots above the mark 3, there are 2 dots above the mark 4 and there is 1 dot above the mark 5. For the bottom dot plot there are there are 4 dots above the mark 4 and there are 4 dots above the mark 5. Which of the following inferences can be made using the dot plots? There is no overlap between the data. Round 2 scores are lower than round 1 scores. Round 1 scores are higher than round 2 scores. The range of round 1 is greater than the round 2 range.

Answers: 3


Other questions on the subject: Mathematics
Mathematics, 21.06.2019 13:00, chickennuggets0621
Amaple syrup producer records th amount of sap collected from each of his trees. the line plot shows the results for one day. what is the least amount of sap any one tree produced?
Answers: 1
Mathematics, 21.06.2019 15:10, pampam49
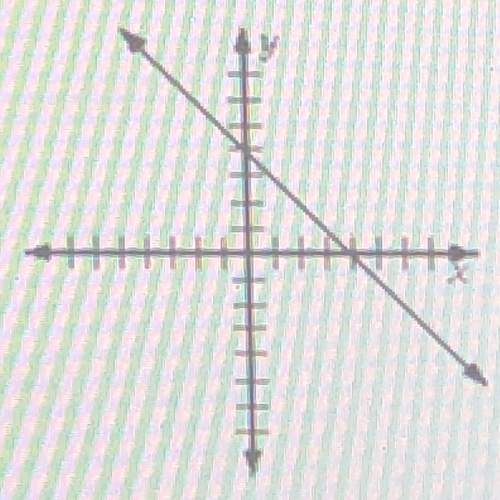
If the graphs of the linear equations in a system are parallel, what does that mean about the possible solution(s) of the system? a. there are infinitely many solutions. b. there is no solution. c. there is exactly one solution. d. the lines in a system cannot be parallel.
Answers: 2
Mathematics, 21.06.2019 17:00, meaghankelly16
Write an equation in point-slope form for the line through the given point that has the given slope (-2,-7); m=-3/2
Answers: 2
Mathematics, 21.06.2019 17:00, sunshine52577oyeor9
Use the graph of the sine function y=2sinθ shown below
Answers: 1
You know the right answer?
The dot plots below show the scores for a group of students for two rounds of a quiz: Two dot plots...
Questions in other subjects:


Mathematics, 22.06.2020 00:57

Arts, 22.06.2020 00:57
Mathematics, 22.06.2020 00:57


