Which inequality does the graph represent?
...

Mathematics, 05.05.2020 08:38 snowww5492
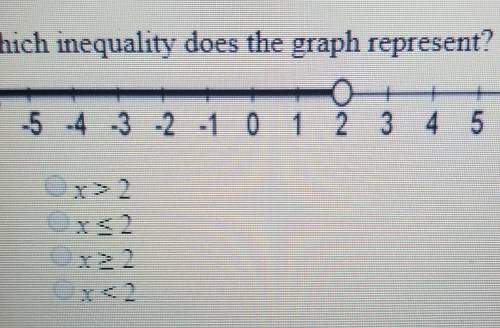
Which inequality does the graph represent?

Answers: 1


Other questions on the subject: Mathematics
Mathematics, 21.06.2019 17:00, averyeverdeen01
Pam buys a sleeve of ball bearings for her skateboard. each of the bearings is 1 1/5 inches wide. the sleeve is 9 3/5 inches long. how many ball bearings are in the sleeve? show your work.
Answers: 3
Mathematics, 21.06.2019 18:30, travorissteele822
The table shows the relationship between the number of cups of cereal and the number of cups of raisins in a cereal bar recipe: number of cups of cereal number of cups of raisins 8 2 12 3 16 4 molly plotted an equivalent ratio as shown on the grid below: a graph is shown. the title of the graph is cereal bars. the horizontal axis label is cereal in cups. the x-axis values are 0, 20, 40, 60, 80,100. the vertical axis label is raisins in cups. the y-axis values are 0, 10, 20, 30, 40, 50. a point is plotted on the ordered pair 40,20. which of these explains why the point molly plotted is incorrect? (a) if the number of cups of cereal is 40, then the number of cups of raisins will be10. (b)if the number of cups of raisins is 40, then the number of cups of cereal will be10. (c) if the number of cups of cereal is 40, then the number of cups of raisins will be 80. (d) if the number of cups of raisins is 40, then the number of cups of cereal will be 80.
Answers: 1
Mathematics, 21.06.2019 20:00, desereemariahha
Someone answer asap for ! the following statements are true about the coins calvin and sasha have collected. * calvin and sasha has the same amount of money. * calvin has only quarters. * sasha has dimes, nickels, and pennies * calvin has the same number of quarters as sasha has dimes. * sasha has $1.95 in coins that are not dimes. exactly how many quarters does calvin have?
Answers: 3
You know the right answer?
Questions in other subjects:

English, 17.11.2019 21:31
Mathematics, 17.11.2019 21:31


Mathematics, 17.11.2019 21:31
History, 17.11.2019 21:31


