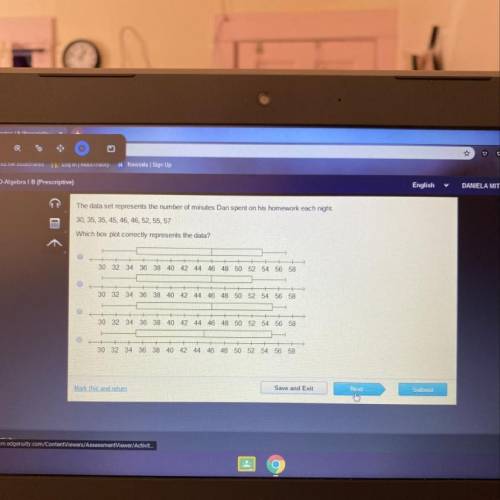
The data set represents the number of minutes Dan spent on his homework each night.
30, 35, 35...

Mathematics, 05.05.2020 11:22 HyperZ
The data set represents the number of minutes Dan spent on his homework each night.
30, 35, 35, 45, 46, 46, 52, 55, 57
Which box plot correctly represents the data?
30 32 34 36 38 40 42 44 46 48 50 52 54 56 58
30
32 34 36
38 40 42 44 46 48 50 52 54 56 58
30 32 34 36
38 40 42 44 46 48 50 52 54 56 58
30 32 34 36
38 40 42 44 46 48 50 52 54 56 58

Answers: 3


Other questions on the subject: Mathematics
Mathematics, 21.06.2019 15:00, thegent1859
This is the number of parts out of 100, the numerator of a fraction where the denominator is 100. submit
Answers: 3
Mathematics, 21.06.2019 21:30, ladydeathanddea
Amira is painting a rectangular banner 2 1/4 yards wide. the banner will have a blue background. amira has enough paint to cover 1 1/2 square yards of the wall. the school colors are blue and yellow, so amira wants to add yellow rectangles on the left and right sides of the blue rectangle. the yellow rectangles will each be 3/4 yards wide and the same height as the blue rectangle. what will be the total area of the two yellow rectangles?
Answers: 3
You know the right answer?
Questions in other subjects:


Social Studies, 06.08.2019 23:20

Social Studies, 06.08.2019 23:20
Mathematics, 06.08.2019 23:20
Mathematics, 06.08.2019 23:20


