50 points for answers(s):
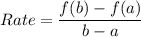
based on the graph, what is the initial value of the linear relati...

Mathematics, 26.08.2019 14:30 ibidnnudny2623
50 points for answers(s):
based on the graph, what is the initial value of the linear relationship?
−2
0
two over three
3
(graph at bottom of page)
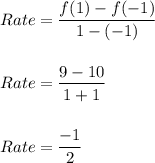
what is the rate of change for the linear relationship modeled in the table?
x
y
−1 =x
10 =y
1= x
9 =y
3=x
8 =y
5=x
7 =y
a. negative one over two
b. 0
c. one over two
d. 2
which scenario best matches the linear relationship expressed in the equation y = 13.50x + 300?
bobby has $300 in the yearbook fund and spends $13.50 on each yearbook.
bobby has $13.50 in the yearbook fund and spends $300 on each yearbook.
bobby has $300 in the yearbook fund and earns $13.50 for each yearbook sold.
bobby has $13.50 in the yearbook fund and earns $300 for each yearbook sold.
which scenario best matches the linear relationship shown in the table?
weeks
dollars
0= weeks
10 = dollars
2= weeks
20 = dollars
4= weeks
30 = dollars
6= weeks
40 = dollars
shanna had $10 in her piggy bank and earned $10 each week in allowance.
shanna had $10 in her piggy bank and earned $5 each week in allowance.
shanna had $10 in her piggy bank and spent $5 each week on stickers.
shanna earns $10 each week.
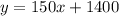
kenny has $1,400 in the bank. he earns $150 every week at his after-school job. what is the rate of change for the scenario described?
2
150
300
1400

Answers: 2


Other questions on the subject: Mathematics
Mathematics, 21.06.2019 19:00, tanaemichel
John used linear combination to solve the system of equations shown. he did so by multiplying the first equation by -3 and the second equation by another number to eliminate the x-terms. what number did jonas multiply the second equation by? 4x-6y=23x+5y=11
Answers: 2
Mathematics, 21.06.2019 22:00, hannahpalmario
The customer price index(cpi), which measures the cost of a typical package of customer goods, was 208.8 in 2011 and 244.1 in 2016.let x=11 corresponding to the year 2011 an estimate to cpi into 2013 and 2014. assume that the data can be modeled by a straight line and the trend to continue idenfinitely. use data points to find such a line and then estimate the requested quantities
Answers: 1
You know the right answer?
Questions in other subjects:


