
Mathematics, 05.05.2020 16:00 unii
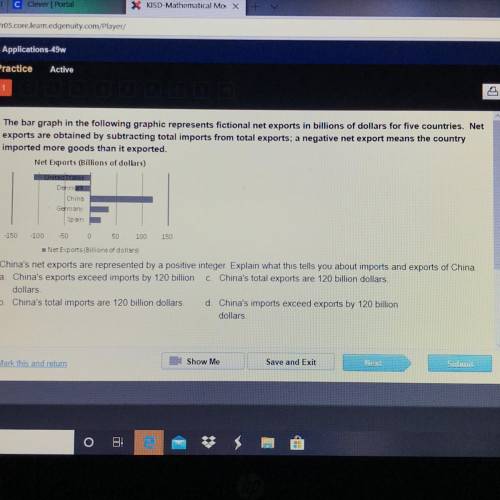
The bar graph in the following graphic represents fictional net exports in billions of dollars for five countries. Net
exports are obtained by subtracting total imports from total exports, a negative net export means the country
imported more goods than it exported.
Net Exports (Billions of dollars)
United States
Denmark
China
• Germany
Spain
-150 100 50 0 50 100 150
Net Exports (Billions of dollars
China's net exports are represented by a positive integer. Explain what this tells you about imports and exports of China
a China's exports exceed imports by 120 billion c. China's total exports are 120 billion dollars.
dollars.
b. China's total imports are 120 billion dollars. d. China's imports exceed exports by 120 billion
dollars

Answers: 2


Other questions on the subject: Mathematics
Mathematics, 21.06.2019 16:30, emberjohnson26
Which ordered pair (c, d) is a solution to the given system of linear equations- c+2d=13 -9c-4d=-15
Answers: 3
Mathematics, 21.06.2019 19:30, valerieaj113
Weekly wages at a certain factory are normally distributed with a mean of $400 and a standard deviation of $50. find the probability that a worker selected at random makes between $450 and $500
Answers: 2
Mathematics, 21.06.2019 22:30, 713073
Which statements about the system are true? check all that apply. y =1/3 x – 4 3y – x = –7 the system has one solution. the system consists of parallel lines. both lines have the same slope. both lines have the same y–intercept. the equations represent the same line. the lines intersect.
Answers: 2
You know the right answer?
The bar graph in the following graphic represents fictional net exports in billions of dollars for f...
Questions in other subjects:


Chemistry, 16.03.2020 04:47

Health, 16.03.2020 04:47

Mathematics, 16.03.2020 04:47

French, 16.03.2020 04:47

History, 16.03.2020 04:47
Health, 16.03.2020 04:47
English, 16.03.2020 04:47


