
Mathematics, 05.05.2020 15:58 dragonstar9771
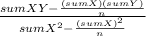
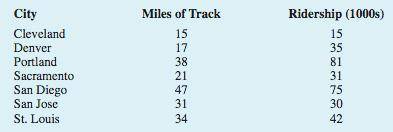
Almost all U. S. light-rail systems use electric cars that run on tracks built at street level. The Federal Transit Administration claims light-rail is one of the safest modes of travel, with an accident rate of .99 accidents per million passenger miles as compared to 2.29 for buses. The following data show the miles of track and the weekday ridership in thousands of passengers for six light-rail systems (USA Today, January 7, 2003).
City Miles of Track Ridership (1000s)
Cleveland 15 15
Denver 17 35
Portland 38 81
Sacramento 21 31
San Diego 47 75
San Jose 31 30
St. Louis 34 42
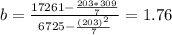
Use these data to develop an estimated regression equation that could be used to predict the ridership given the miles of track.
Did the estimated regression equation provide a good fit? Explain.
Develop a 95% confidence interval for the mean weekday ridership for all light-rail systems with 30 miles of track.
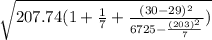
Suppose that Charlotte is considering construction of a light-rail system with 30 miles of track. Develop a 95% prediction interval for the weekday ridership for the Charlotte system. Do you think that the prediction interval you developed would be of value to Charlotte planners in anticipating the number of weekday riders for their new light-rail system? Explain.

Answers: 2

 *
* ![\sqrt{Se^2(\frac{1}{n}+\frac{(X_0-X[bar])^2}{sumX^2-\frac{(sumX)^2}{n} } )}](/tpl/images/0639/9123/480b3.png)

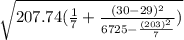
 =30miles
![\sqrt{Se^2(1+\frac{1}{n}+\frac{(X_{n+1}-X[bar])^2}{sumX^2-\frac{(sumX)^2}{n} } )}](/tpl/images/0639/9123/a8cd5.png)


Other questions on the subject: Mathematics
Mathematics, 21.06.2019 17:30, bradleycawley02
Lems1. the following data set represents the scores on intelligence quotient(iq) examinations of 40 sixth-grade students at a particular school: 114, 122, 103, 118, 99, 105, 134, 125, 117, 106, 109, 104, 111, 127,133, 111, 117, 103, 120, 98, 100, 130, 141, 119, 128, 106, 109, 115,113, 121, 100, 130, 125, 117, 119, 113, 104, 108, 110, 102(a) present this data set in a frequency histogram.(b) which class interval contains the greatest number of data values? (c) is there a roughly equal number of data in each class interval? (d) does the histogram appear to be approximately symmetric? if so, about which interval is it approximately symmetric?
Answers: 3
Mathematics, 21.06.2019 21:00, hastephens03
Mr. thompson is on a diet. he currently weighs 260 pounds. he loses 4 pounds per month. what part of the story makes the relationship not proportional?
Answers: 3
You know the right answer?
Almost all U. S. light-rail systems use electric cars that run on tracks built at street level. The...
Questions in other subjects:

Biology, 07.01.2020 22:31


Chemistry, 07.01.2020 22:31
Mathematics, 07.01.2020 22:31

Mathematics, 07.01.2020 22:31


