
Mathematics, 05.05.2020 17:28 conradbeckford6813
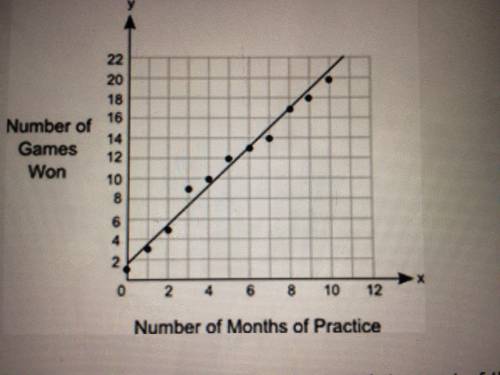
The graph below shows the relationship between the number of months different students practice baseball in the number of games they won.
Part A: What is the approximate Y intercept of the line of best fit and what does it represent?
Part B: Write the equation for the line of best fit in slope intercept form and use it to predict the number of games that could be one after 13 months of practice show you working include the points used to calculate the slope.

Answers: 1


Other questions on the subject: Mathematics
Mathematics, 21.06.2019 18:30, anabellabenzaquen
The volume of a sphere is increased by 6%. calculate the corresponding percentage increased in it area.
Answers: 3
Mathematics, 21.06.2019 19:00, mylittleponeyfbrarit
When keisha installed a fence along the 200 foot perimeter of her rectangular back yard, she left an opening for a gate. in the diagram below, she used x to represent the length in feet of the gate? what is the value? a. 10 b. 20 c. 25 d. 30
Answers: 1
You know the right answer?
The graph below shows the relationship between the number of months different students practice base...
Questions in other subjects:


History, 14.12.2019 22:31


Health, 14.12.2019 22:31

Social Studies, 14.12.2019 22:31
Mathematics, 14.12.2019 22:31


