Score (points)

Mathematics, 05.05.2020 17:06 katiebonar13
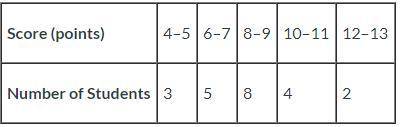
A group of 22 students participated in a race. Their scores are below:
Score (points)
4–5
6–7
8–9
10–11
12–13
Number of Students
3
5
8
4
2
Would a dot plot or a histogram best represent the data presented here? Why?
Group of answer choices
Dot plot, because a large number of scores are reported as ranges
Dot plot, because a small number of scores are reported individually
Histogram, because a large number of scores are reported as ranges
Histogram, because a small number of scores are reported individually

Answers: 2


Other questions on the subject: Mathematics
Mathematics, 21.06.2019 17:00, ChooseHappy
One side of a rectangle is 7 feet shorter than seven times the other side. find the length of the shorter side if we also know that the perimeter of the rectangle is 306 feet.
Answers: 2
Mathematics, 21.06.2019 21:10, verdolaga2017me
What is the domain of the given function? {(3,-2), (6, 1), (-1, 4), (5,9), (-4, 0); o {x | x= -4,-1, 3, 5, 6} o {yl y = -2,0, 1,4,9} o {x|x = -4,-2, -1,0, 1, 3, 4, 5, 6, 9} o y y = 4,-2, -1, 0, 1, 3, 4, 5, 6, 9}
Answers: 1
You know the right answer?
A group of 22 students participated in a race. Their scores are below:
Score (points)
Score (points)
Questions in other subjects:
Mathematics, 20.11.2020 03:50

Biology, 20.11.2020 03:50

Social Studies, 20.11.2020 03:50
Mathematics, 20.11.2020 03:50


History, 20.11.2020 03:50
Mathematics, 20.11.2020 03:50
English, 20.11.2020 03:50


