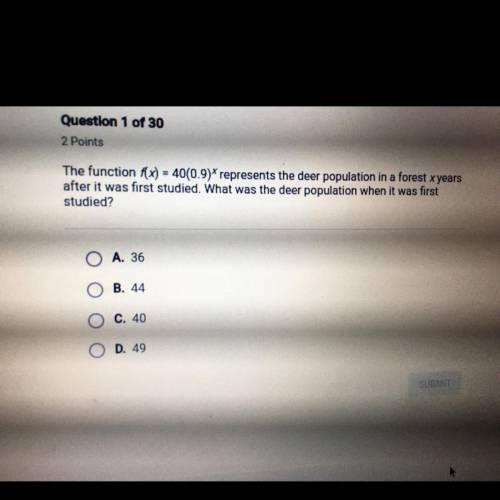
The function f(x) = 40(0.9)* represents the deer population in a forest x years
after it was f...

Mathematics, 05.05.2020 22:06 richisolano14
The function f(x) = 40(0.9)* represents the deer population in a forest x years
after it was first studied. What was the deer population when it was first
studied?


Answers: 2


Other questions on the subject: Mathematics

Mathematics, 21.06.2019 15:00, vnzgirl
1. there are 25 students who started computer programming in elementary school and 25 students who started computer programming in middle school. the first group had a mean final project grade of 95% and the second group had a mean final project grade of 92%. the line plot shows the differences after 10 rerandomizations. determine whether the difference in the means of the two groups is significant based on the line plot. explain your answer.
Answers: 1

Mathematics, 21.06.2019 17:00, reaunnatowns
High schoolmathematics 5 points keith is the leading goal scorer for a team in an ice hockey league. last season, he scored 42 goals in 82 games. assuming he scores goals at a constant rate, what is the slope of the line that represents this relationship if the number of games is along the x-axis and the number of goals is along the y-axis?
Answers: 1

Mathematics, 21.06.2019 19:30, danielahalesp87vj0
Can someone me with these two circle theorem questions asap?
Answers: 2

Mathematics, 21.06.2019 22:50, zitterkoph
Listed below are time intervals (min) between eruptions of a geyser. assume that the "recent" times are within the past few years, the "past" times are from around 20 years ago, and that the two samples are independent simple random samples selected from normally distributed populations. do not assume that the population standard deviations are equal. does it appear that the mean time interval has changed? is the conclusion affected by whether the significance level is 0.10 or 0.01? recent 78 90 90 79 57 101 62 87 71 87 81 84 57 80 74 103 62 past 88 89 93 94 65 85 85 92 87 91 89 91 follow the steps of hypothesis testing, including identifying the alternative and null hypothesis, calculating the test statistic, finding the p-value, and making a conclusions about the null hypothesis and a final conclusion that addresses the original claim. use a significance level of 0.10. is the conclusion affected by whether the significance level is 0.10 or 0.01? answer choices below: a) yes, the conclusion is affected by the significance level because h0 is rejected when the significance level is 0.01 but is not rejected when the significance level is 0.10. b) no, the conclusion is not affected by the significance level because h0 is not rejected regardless of whether a significance level of 0.10 or 0.01 is used. c) yes, the conclusion is affected by the significance level because h0 is rejected when the significance level is 0.10 but is not rejected when the significance level is 0.01. d) no, the conclusion is not affected by the significance level because h0 is rejected regardless of whether a significance level of 0.10 or 0.01 is used.
Answers: 3
You know the right answer?
Questions in other subjects:

Computers and Technology, 30.12.2020 07:40

English, 30.12.2020 07:40


Mathematics, 30.12.2020 07:40

Arts, 30.12.2020 07:40


Mathematics, 30.12.2020 07:40


