PLEASE HELPPP:))
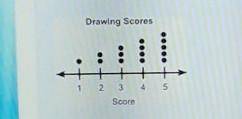
The dot plot below shows the drawing scores of some students:
Drawing Sco...

Mathematics, 06.05.2020 00:12 babyj93
PLEASE HELPPP:))
The dot plot below shows the drawing scores of some students:
Drawing Scores
Which statement best describes the shape of the data?
It is not symmetric and has a peak at 1.
It is not symmetric and has a peak at 5.
It is symmetric and has a peak at 1.
It is symmetric and has a peak at 5.
(Please no guessing)
:)

Answers: 3


Other questions on the subject: Mathematics
Mathematics, 21.06.2019 13:00, ecarter8967
The lines shown below are parallel. if the green line has a slope of -1, what is the slope of the red line
Answers: 2
Mathematics, 21.06.2019 17:30, cfnewton09
Astudent survey asked: "how tall are you (in inches)? " here's the data: 67, 72, 73, 60, 65, 86, 72, 69, 74 give the five number summary. a. median: 73, mean: 70.89, iqr: 5, min: 60, max: 74 b. 60, 66, 72, 73.5, 86 c. 60, 67, 72, 73, 74 d. 0, 60, 70, 89, 74, 100
Answers: 3
Mathematics, 21.06.2019 21:50, lilybrok04
(x-5)1/2+5=2 what is possible solution of this equation
Answers: 1
You know the right answer?
Questions in other subjects:
Mathematics, 22.07.2019 07:00
Mathematics, 22.07.2019 07:00


Biology, 22.07.2019 07:00
History, 22.07.2019 07:00
Social Studies, 22.07.2019 07:00
Biology, 22.07.2019 07:00


