
Mathematics, 06.05.2020 04:12 jerria73
The state education commission wants to estimate the fraction of tenth grade students that have reading skills at or below the eighth grade level.
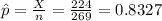
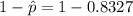
a. Suppose a sample of 269 tenth graders is drawn. Of the students sampled, 224 read above the eighth grade level. Using the data, estimate the proportion of tenth graders reading at or below the eighth grade level. Enter your answer as a fraction or a decimal number rounded to three decimal places.
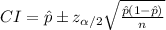
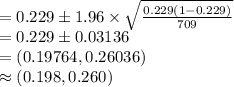
b. Suppose a sample of 709 tenth graders is drawn. Of the students sampled, 546 read above the eighth grade level. Using the data, construct the 95% confidence interval for the population proportion of tenth graders reading at or below the eighth grade level. Round your answers to three decimal places.

Answers: 2


Other questions on the subject: Mathematics
Mathematics, 21.06.2019 18:00, cashhd1212
The given dot plot represents the average daily temperatures, in degrees fahrenheit, recorded in a town during the first 15 days of september. if the dot plot is converted to a box plot, the first quartile would be drawn at __ , and the third quartile would be drawn at __ link to graph: .
Answers: 1
Mathematics, 21.06.2019 20:30, amauris77748
There are 45 questions on your math exam. you answered 810 of them correctly. how many questions did you answer correctly?
Answers: 3
You know the right answer?
The state education commission wants to estimate the fraction of tenth grade students that have read...
Questions in other subjects:


Spanish, 21.06.2019 13:40

English, 21.06.2019 13:40
Mathematics, 21.06.2019 13:40


