
Mathematics, 06.05.2020 04:03 jpsaad00
For the following description of data, identify the W's, name the variables, specify for each variable whether its use indicates it should be treated as categorical or quantitative, and for any quantitative variable identify the units in which it was measured (or note that they were not provided). Specify whether the data come from a designed survey or experiment. Are the variables time series or cross-sectional? Report any concerns you have as well. An online survey of students in a large MBA Economics class at a business school in the northeastern United States asked them to report their total personal investment in the stock market (S), total number of shares of stocks currently held, total invested in mutual funds (S), and the name of each mutual fund in which they have invested. The data were used in the aggregate for classroom illustrations. Who was measured?
A. Students in a large MBA Economics class
B. Students in the northeastern United States
C. Students at a business school
D. This information is not given.

Answers: 3


Other questions on the subject: Mathematics
Mathematics, 21.06.2019 16:20, williamsgregg5214
Which mathematical statements are true? 1) if 3 is an odd number, then 3 times 3 is an even number. 2) if 6 is less than 7, then 4 is greater than 7. 3) six is divisible by 3, and 10 is a multiple of 2. 4) the average of the data is greater than the largest value in the data, or it’s less than the largest value in the data. 5) the slope of a linear graph is its rate of change, and the graph’s y-intercept is the initial value. 6) if an equilateral triangle has equal angles, then all its angles will measure 45°.
Answers: 3
Mathematics, 21.06.2019 22:20, abbygriffin8575
Which graph has figures that can undergo a similarity transformation to justify that they are similar? (obviously not the third one)
Answers: 2
Mathematics, 22.06.2019 00:30, amc9639
Ican interpret and represent the remainder in division calculations sensibly for the context (eg if we wont to know how many 40 seat buses will be needed to transport 170 students for on excursion, we divide 170 by 40 and realise buses and another smaller vehicle to that we need 4 transport 10 more students) solve the following questions. show your work! 11) the zoo had 420 butterflies that needed to be transported to a new enclosure. the boxes that the butterflies would be moved in only hold 80 butterflies in each. how many boxes would they need? 2 12) each classroom in the school can have exactly 25 students, if there are 345 students in the school how many full classrooms are there?
Answers: 2
Mathematics, 22.06.2019 01:00, nyraimccall408
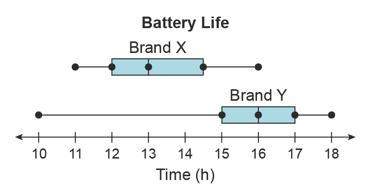
Which is an accurate comparison of the two data sets? the commute to work is typically shorter and more consistent than the commute home. the commute to work is typically shorter but less consistent than the commute home. the commute to work is typically longer and less consistent than the commute home. the commute to work is typically longer but more consistent than the commute home.
Answers: 2
You know the right answer?
For the following description of data, identify the W's, name the variables, specify for each variab...
Questions in other subjects:

Mathematics, 17.03.2021 23:50
Mathematics, 17.03.2021 23:50


Mathematics, 17.03.2021 23:50
Chemistry, 17.03.2021 23:50
Mathematics, 17.03.2021 23:50

Mathematics, 17.03.2021 23:50


