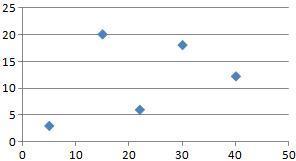
Which type of graph would you want to use to show the frequency of an interval?
line gra...

Mathematics, 06.05.2020 05:30 thesusan56351
Which type of graph would you want to use to show the frequency of an interval?
line graph
histogram
box-and-whisker plot
stem-and-leaf plot

Answers: 3


Other questions on the subject: Mathematics

Mathematics, 21.06.2019 16:30, jrfranckowiak
You are making a blueprint of your bedroom and you plan to use a scale factor of 18 . the actual width of your room is 14 feet and the actual length of your room is 16 feet. determine the width and length of your room on the blueprint. on the blueprint, your room will have a width of feet and a length of feet.
Answers: 2


Mathematics, 22.06.2019 03:30, daisyramirez2057
Mahnoor randomly selects times to walk into a local restaurant and observe the type of music being played she found that the restaurant was playing country 11 times rock & roll 17 times and blues 8 times use the observed frequencies to create a probability model for the type of music the restaurant is playing the next time mahnoor walks in.
Answers: 1

Mathematics, 22.06.2019 04:30, aambitiouss
Astore has 20% off sale of pants. whith this discount , the pricw of one pair of pants before tax is $15.20. what was the original price of the pants?
Answers: 1
You know the right answer?
Questions in other subjects:


Mathematics, 22.01.2021 23:00

Mathematics, 22.01.2021 23:00

Mathematics, 22.01.2021 23:00


Mathematics, 22.01.2021 23:00

Physics, 22.01.2021 23:00

Mathematics, 22.01.2021 23:00


