
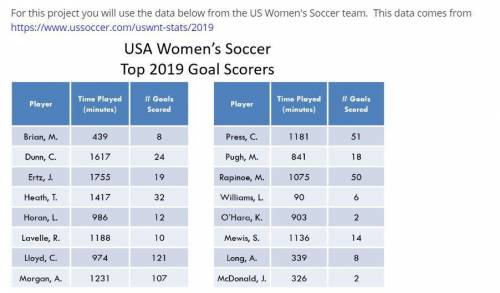
1 fill in the frequency table for time played in minutes.
2 Use desmos to make a histogram for...

Mathematics, 06.05.2020 06:08 lindseycagle00
1 fill in the frequency table for time played in minutes.
2 Use desmos to make a histogram for the frequency table in #2. Take a screenshot of your histogram and save it on your computer. and put it on here
3 Describe your histogram in #3 in 1-2 sentences. What type of data distribution is this (bell, uniform, skewed right, or skewed left)? How do you know what type of distribution your graph shows?
4 fill in the frequency table for # of goals scored.
5 make a histogram for the frequency table in #5. Take a screenshot of your histogram and save it on your computer. and share it here please
Describe your histogram in #6 in 1-2 sentences. What type of data distribution is this (bell, uniform, skewed right, or skewed left)? How do you know what type of distribution your graph shows?
thank you :)

Answers: 1


Other questions on the subject: Mathematics
Mathematics, 21.06.2019 18:00, julliette27
What power can you write to represent the volume of the cube shown? write the power as an expression with a base and an exponent and then find the volume of the cube
Answers: 3
Mathematics, 21.06.2019 23:30, ashiteru123
The average daily maximum temperature for laura’s hometown can be modeled by the function f(x)=4.5sin(πx/6)+11.8 , where f(x) is the temperature in °c and x is the month. x = 0 corresponds to january. what is the average daily maximum temperature in may? round to the nearest tenth of a degree if needed. use 3.14 for π .
Answers: 1
Mathematics, 22.06.2019 01:20, Hockeypro1127
The bottom of a slide at the playground is 6 feet from the base of the play set. the length of the slide is 10 feet. how tall is the slide. 11.66 feet 10 feet 6 feet 8 feet
Answers: 2
You know the right answer?
Questions in other subjects:
Mathematics, 13.05.2021 06:10
Mathematics, 13.05.2021 06:10

Social Studies, 13.05.2021 06:10


Spanish, 13.05.2021 06:10


Mathematics, 13.05.2021 06:10


