
Mathematics, 06.05.2020 05:58 maddie7155
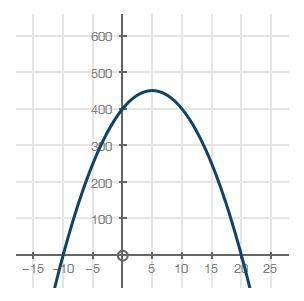
A biologist created the following graph to show the relationship between the temperature of water (x), in degrees Celsius, and the number of insect larvae (y) in the water:
What does the peak of the graph represent?
The number of larvae in the water is greatest at 450 degrees Celsius.
The number of larvae in the water is greatest at 5 degrees Celsius.
The least number of larvae in the water is 450.
The least number of larvae in the water is 5.

Answers: 3


Other questions on the subject: Mathematics
Mathematics, 21.06.2019 17:00, jaejaeJae9534
Rectangle leg this 11feet and perimeter of 38feet what is the width of the rectangle in feet
Answers: 1
Mathematics, 21.06.2019 18:30, george6871
Abus travels 36 miles in 45 minutes. enter the number of miles the bus travels in 60 minutes at this rate.
Answers: 2
You know the right answer?
A biologist created the following graph to show the relationship between the temperature of water (x...
Questions in other subjects:

History, 21.10.2021 02:00


Mathematics, 21.10.2021 02:00

Physics, 21.10.2021 02:00
Mathematics, 21.10.2021 02:00

Social Studies, 21.10.2021 02:00


