
Mathematics, 06.05.2020 07:41 alejandr1872913
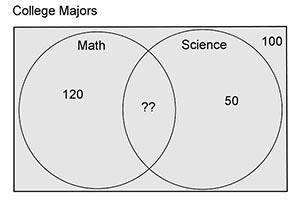
Three hundred high school seniors were surveyed about their intended college majors. The results are displayed in the Venn Diagram below: {see image.}
If a student is randomly selected from the group, what is the probability that they are majoring in both math and science? Round your answer to the nearest whole percent.
10%
17%
33%
40%

Answers: 1


Other questions on the subject: Mathematics
Mathematics, 21.06.2019 18:00, purplefish53
Jose predicted that he would sell 48 umbrellas. he actually sold 72 umbrellas. what are the values of a and b in the table below? round to the nearest tenth if necessary
Answers: 2
Mathematics, 21.06.2019 21:40, Blakemiller2020
Which of the following best describes the graph below? + + 2 + 3 + 4 1 o a. it is not a function. o b. it is a one-to-one function. o c. it is a many-to-one function. o d. it is a function, but it is not one-to-one.
Answers: 3
Mathematics, 22.06.2019 00:30, winterblanco
1/2+1/6-3/4 simplify the given expression leaving the answer in improper fraction form.
Answers: 2
You know the right answer?
Three hundred high school seniors were surveyed about their intended college majors. The results are...
Questions in other subjects:


English, 18.08.2021 17:10
English, 18.08.2021 17:20
Mathematics, 18.08.2021 17:20


