
Mathematics, 06.05.2020 07:58 estefaniapenalo
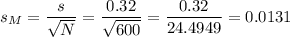
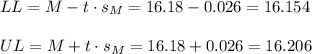
A large soda producer is interested in determining the average number of ounces of soda in their bottles labeled 16 ounces. A random sample of 600 bottles is selected from that day's total production. The average number of ounces of soda is found to be 16.18 with a standard deviation of 0.32 ounces. Find a 95% confidence interval for the mean number of ounces of soda in such packaging.
a) is this a "proportion of success" or a "means" problem?
b) what calculator function are you using?
c) what confidence interval did you get?
d) interpret the confidence interval in context. Be sure to use the words of the problem.

Answers: 3


Other questions on the subject: Mathematics
Mathematics, 21.06.2019 20:20, oofoofoof1
Sample response: if the graph passes the horizontaline test, then the function is one to one. functions that are one to one have inverses that a therefore, the inverse is a hinction compare your response to the sample response above. what did you include in your explanation? a reference to the horizontal-line test d a statement that the function is one-to-one the conclusion that the inverse is a function done
Answers: 2
Mathematics, 21.06.2019 22:20, dontworry48
Which graph represents the given linear function 4x+2y=3
Answers: 1
You know the right answer?
A large soda producer is interested in determining the average number of ounces of soda in their bot...
Questions in other subjects:

Mathematics, 07.06.2021 20:30
Mathematics, 07.06.2021 20:30


Mathematics, 07.06.2021 20:30


