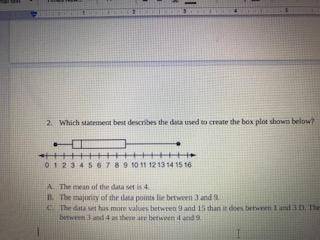
Which statement best describes the data used to create the box plot shown below?
The me...

Mathematics, 26.04.2020 07:45 davia97
Which statement best describes the data used to create the box plot shown below?
The mean of the data set is 4.
The majority of the data points lie between 3 and 9.
The data set has more values between 9 and 15 than it does between 1 and 3 D. There are as many data points between 3 and 4 as there are between 4 and 9.

Answers: 2


Other questions on the subject: Mathematics
Mathematics, 21.06.2019 18:50, casianogabriel2004
Which expression shows the sum of the polynomials with like terms grouped together
Answers: 2
Mathematics, 21.06.2019 19:30, joselinegarciaowyrpf
Asquare picture with sides of 32 inches is to be mounted on a square mat with sides of 52 inches. find the area of the mat that will remain uncovered by the picture.
Answers: 1
Mathematics, 21.06.2019 20:10, paigeleahfarbeoy2ork
Which ratios are equivalent to 10: 16? check all that apply. 30 to 48 25: 35 8: 32 5 to 15
Answers: 1
You know the right answer?
Questions in other subjects:

Chemistry, 10.12.2020 22:10
Mathematics, 10.12.2020 22:10
Chemistry, 10.12.2020 22:10

Mathematics, 10.12.2020 22:10


Health, 10.12.2020 22:10


