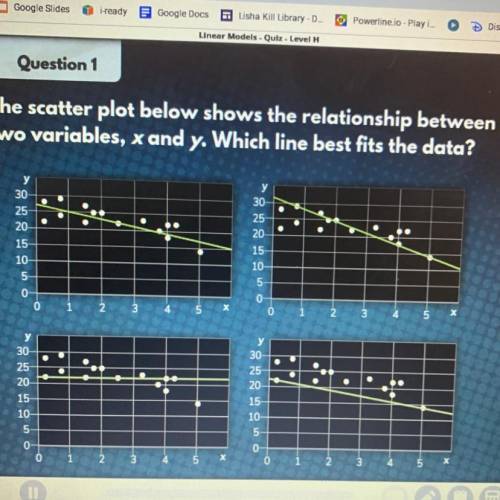
The scatterplot below shows the relationships, X and Y. Which line best fits the data??
...

Mathematics, 25.04.2020 20:30 angelgrant780
The scatterplot below shows the relationships, X and Y. Which line best fits the data??

Answers: 1


Other questions on the subject: Mathematics
Mathematics, 22.06.2019 00:30, goverton101
Consider this expression and the steps to evaluate it. 4^5(−2)^9/4^8(−2)^3 1. apply the quotient of powers: (−2)^a/4^b 2. evaluate powers: c/d select the value of each variable. a = _ b = _ c = _ d = _
Answers: 3
You know the right answer?
Questions in other subjects:

Social Studies, 01.04.2021 21:50


Arts, 01.04.2021 21:50
Mathematics, 01.04.2021 21:50


