
Mathematics, 25.04.2020 16:30 nova97
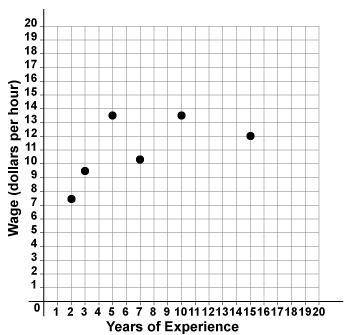
The scatter plot shows the relationship at a company between years of experience and wages in dollars per hour.
The equation for the line of best fit is y = 0.44x + 7.25.
What does the slope of the line of best fit represent?
Each additional year of experience means on average a wage increase of $0.44 per hour.
Starting wages at the company with no experience are approximately $7.69 per hour.
Each additional year of experience means on average a wage increase of $7.25 per hour.
Starting wages at the company with no experience are approximately $0.44 per hour.

Answers: 1


Other questions on the subject: Mathematics
Mathematics, 21.06.2019 17:30, Vampfox
Monthly water bills for a city have a mean of $108.43 and a standard deviation of $32.09. find the probability that a randomly selected bill will have an amount greater than $155, which the city believes might indicate that someone is wasting water. would a bill that size be considered unusual?
Answers: 1
Mathematics, 21.06.2019 18:30, Katlyndavis01
What is the answer to this question? i'm a bit stumped. also how do i do it? 5(x - 4) = 2(x + 5)
Answers: 1
Mathematics, 21.06.2019 23:00, karyme12
I'm at a bookstore with $\$35$ in my pocket and a $20\%$-off coupon. what is the cost of the most expensive book i can buy with my money and the coupon? (assume that there are books of every possible price in the bookstore. it's a large bookstore! )
Answers: 1
Mathematics, 21.06.2019 23:50, lukecarroll19521
What is the cube root of -1,000p^12q3? -10p^4 -10p^4q 10p^4 10p^4q
Answers: 3
You know the right answer?
The scatter plot shows the relationship at a company between years of experience and wages in dollar...
Questions in other subjects:


Computers and Technology, 16.04.2021 07:50


Business, 16.04.2021 07:50


