
Mathematics, 25.04.2020 11:20 taibamah
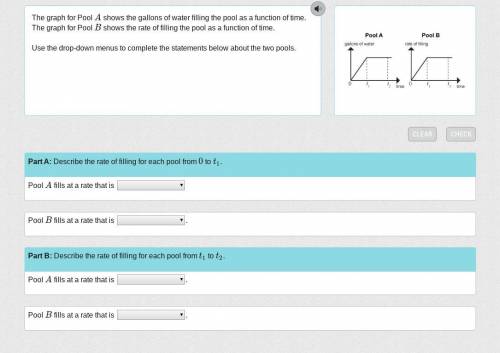
The graph for Pool A shows the gallons of water filling the pool as a function of time. The graph for Pool B shows the rate filling the pool as a function of time.
Part A: Describe the rate of filling for each pool from 0 to t1.
#1 Part A: Pool A fills at a rate that is
a. increasing
b. decreasing
c. 0
d. constant but 0
#2 Part A: Pool B fills at a rate that is
a. increasing
b. decreasing
c. 0
d. constant but 0
Part B: Describe the rate of filling for each pool from t1 to t2.
#3 Part B: Pool A fills at a rate that is
a. increasing
b. decreasing
c. 0
d. constant but 0
#4 Part B: Pool B fills at a rate that is
a. increasing
b. decreasing
c. 0
d. constant but 0

Answers: 3


Other questions on the subject: Mathematics
Mathematics, 21.06.2019 13:30, alleshia2007
If 1/2+2/5s=s-3/4,what is the value of s? a. s=3/4 b. s=25/12 c. s=-25/12 d. s=-3/4
Answers: 1
Mathematics, 21.06.2019 15:00, NicoleQuinn
Find the sum of the measure of the interior angles of a polygon of 9 sides ; of 32 sides
Answers: 1
Mathematics, 21.06.2019 15:30, potato1458
What is the best reason for jacinta to have a savings account in addition to a checking account
Answers: 1
Mathematics, 21.06.2019 18:10, heybrothwrlogan
Points a, b, and c form a triangle. complete the statements to prove that the sum of the interior angles of triangle abc is 180
Answers: 1
You know the right answer?
The graph for Pool A shows the gallons of water filling the pool as a function of time. The graph fo...
Questions in other subjects:
Mathematics, 22.07.2019 23:00

Mathematics, 22.07.2019 23:00


Mathematics, 22.07.2019 23:00
English, 22.07.2019 23:00
Mathematics, 22.07.2019 23:00


