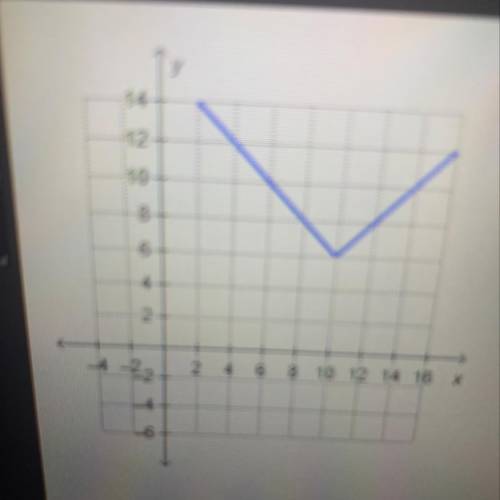
The graph of h(x) = |x-10| +6 is shown. On which interval
is this graph increasing?
O (-...

Mathematics, 24.04.2020 23:36 XOsam
The graph of h(x) = |x-10| +6 is shown. On which interval
is this graph increasing?
O (-0,6)
O (-0,10)
O (60)
(10,-)
4-22
2
4
6
8 10 12 14 16
x

Answers: 3


Other questions on the subject: Mathematics
Mathematics, 21.06.2019 17:30, sarinawhitaker
25 ! the line of best fit is h = 5a + 86. predict the height at age 16. show your work.
Answers: 1
Mathematics, 21.06.2019 20:10, morgantisch25
A. use the formula for continuous compounding with the original example: $1000 invested at 2% for 1 year. record the amount to 5 decimal places. use a calculator. b. compare it to the result using the original compound interest formula with n = 365 calculated to 5 decimal places. which has a larger value? explain.
Answers: 1
You know the right answer?
Questions in other subjects:
Mathematics, 02.11.2019 01:31
Mathematics, 02.11.2019 01:31


Chemistry, 02.11.2019 01:31

History, 02.11.2019 01:31


