
Mathematics, 24.04.2020 23:38 ranmmm
The table below shows the year and the number of households in a building that had high-speed broadband
internet access.
11
16
23
33
42
47
Year
2002 2003 2004 2005 2006 2007
For which interval of time was the average rate of change the smallest?
2002 - 2004
3) 2004 - 2006
2) 2003 - 2005
2005 - 2007

Answers: 1


Other questions on the subject: Mathematics
Mathematics, 21.06.2019 18:00, woebrooke11
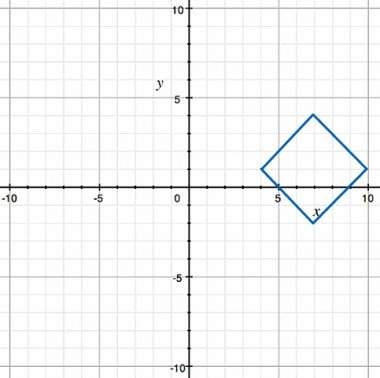
Me, prove a quadrilateral with vertices g(1,-1), h(5,1), i(4,3) and j(0,1) is a rectangle using the parallelogram method and a rectangle method.
Answers: 3
Mathematics, 21.06.2019 18:30, jamilecalderonpalaci
Solve 2x2 + 8 = 0 by graphing the related function. there are two solutions: . there are no real number solutions. there are two solutions: 2 and -2
Answers: 3
You know the right answer?
The table below shows the year and the number of households in a building that had high-speed broadb...
Questions in other subjects:

Mathematics, 26.04.2021 21:50


Social Studies, 26.04.2021 21:50
Social Studies, 26.04.2021 21:50

English, 26.04.2021 21:50
Mathematics, 26.04.2021 21:50
English, 26.04.2021 21:50


