
Mathematics, 24.04.2020 21:58 andy3646
The sets of data below show the heights, in inches, of students in two different preschool classes. A box plot titled Class 1. The number line goes from 38 to 49. The whiskers range from 39 to 48, and the box ranges from 40 to 43. A line divides the box at 41. Class 1 A box plot titled Class 2. The number line goes from 38 to 49. The whiskers range from 38 to 49, and the box ranges from 39 to 42. A line divides the box at 41. Class 2 The teachers of the two classes want to compare the heights of their students. Which statements about the data sets are accurate? Select three options.

Answers: 1


Other questions on the subject: Mathematics
Mathematics, 21.06.2019 18:00, bobjill1609
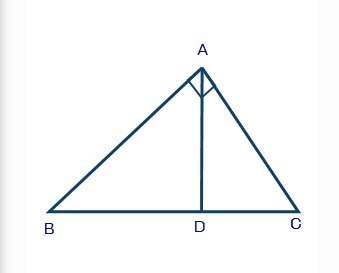
The center of the circumscribed circle lies on line segment and the longest side of the triangle is equal to the of the circle.
Answers: 2
Mathematics, 21.06.2019 18:30, george6871
Abus travels 36 miles in 45 minutes. enter the number of miles the bus travels in 60 minutes at this rate.
Answers: 2
Mathematics, 21.06.2019 22:00, marissastewart533
Given sin∅ = 1/3 and 0 < ∅ < π/2 ; find tan2∅ a. (4√2)/9 b. 9/7 c. (4√2)/7 d.7/9
Answers: 2
You know the right answer?
The sets of data below show the heights, in inches, of students in two different preschool classes....
Questions in other subjects:

English, 20.04.2020 20:35

Mathematics, 20.04.2020 20:35


Mathematics, 20.04.2020 20:35

Mathematics, 20.04.2020 20:35


