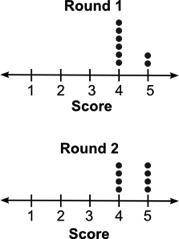
The dot plots below show the scores for a group of students for two rounds of a quiz:
Wh...

Mathematics, 24.04.2020 20:31 adalan6986
The dot plots below show the scores for a group of students for two rounds of a quiz:
Which of the following inferences can be made using the dot plots?
There is no overlap between the data.
The range of each round is the same.
Round 1 scores are higher than round 2 scores.
Round 2 scores are lower than round 1 scores.

Answers: 1


Other questions on the subject: Mathematics
Mathematics, 21.06.2019 20:20, Kelbee781
Each person in an it department of 25 people works on at least one of 3 major projects: system security, program implementation, platform development. 10 people work on system security, 13 work on program implementation, and 12 work on platform development. 4 people work on system security and platform development, 5 people work on program implementation and platform development, and 2 people work on all three projects. how many people work on system security and program implementation?
Answers: 1
You know the right answer?
Questions in other subjects:

Social Studies, 28.06.2019 16:30

Mathematics, 28.06.2019 16:30

History, 28.06.2019 16:30
English, 28.06.2019 16:30


