
Mathematics, 24.04.2020 20:39 ashleychantal99
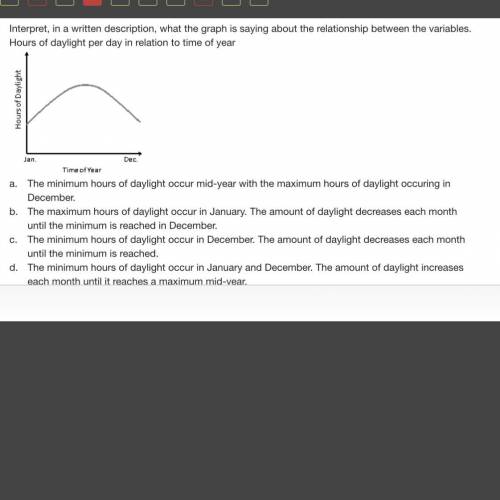
Interpret, in a written description, what the graph is saying about the relationship between the variables.
Hours of daylight per day in relation to time of year
a.
The minimum hours of daylight occur mid-year with the maximum hours of daylight occuring in December.
b.
The maximum hours of daylight occur in January. The amount of daylight decreases each month until the minimum is reached in December.
c.
The minimum hours of daylight occur in December. The amount of daylight decreases each month until the minimum is reached.
d.
The minimum hours of daylight occur in January and December. The amount of daylight increases each month until it reaches a maximum mid-year.

Answers: 1


Other questions on the subject: Mathematics
Mathematics, 21.06.2019 19:00, laneake96
Hector and alex traded video games. alex gave hector one fourth of his video games in exchange for 6 video games. then he sold 3 video games and gave 2 video games to his brother. alex ended up with 16 video games. how many video games did alex have when he started?
Answers: 2
Mathematics, 21.06.2019 19:30, jasminetaylor4587
According to the data set, where should the upper quartile line of the box plot be placed?
Answers: 1
Mathematics, 21.06.2019 21:30, francescanajar5
Your friend uses c=50p to find the total cost, c, for the people, p, entering a local amusement park is the cost of admission proportional to the amount of people entering the amusement park? explain.
Answers: 2
Mathematics, 21.06.2019 22:00, LuckyCharms988
What is the solution to the equation e3x=12? round your answer to the nearest hundredth
Answers: 1
You know the right answer?
Interpret, in a written description, what the graph is saying about the relationship between the var...
Questions in other subjects:


English, 04.08.2019 07:20


