
Mathematics, 24.04.2020 20:40 erikagibson3414
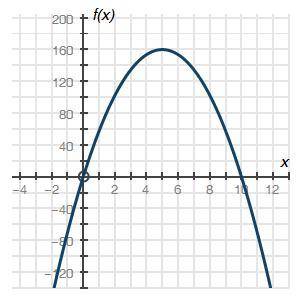
The graph below shows a company's profit f(x), in dollars, depending on the price of pencils x, in dollars, sold by the company:
Graph of quadratic function f of x having x intercepts at ordered pairs negative 0, 0 and 10, 0. The vertex is at 5, 160.
Part A: What do the x-intercepts and maximum value of the graph represent? What are the intervals where the function is increasing and decreasing, and what do they represent about the sale and profit? (4 points)
Part B: What is an approximate average rate of change of the graph from x = 2 to x = 5, and what does this rate represent? (3 points)
Part C: Describe the constraints of the domain. (3 points)

Answers: 1


Other questions on the subject: Mathematics
Mathematics, 21.06.2019 18:00, TheIncognateo
The larger of two number is 4 less than twice the smaller number. the sum is 41. find the numbers
Answers: 2
Mathematics, 21.06.2019 23:00, look26goingjbgy
Complete the conditional statement. if a + 2 < b + 3, then a < b b < a a – b < 1 a < b + 1
Answers: 3
Mathematics, 22.06.2019 00:30, jjjones2233
The mean average cost of standard room per night at a hostel is ? 20.60. therefore, how much does a standard room cost per night at night-time rest days?
Answers: 1
Mathematics, 22.06.2019 02:30, sariahieveryone
Ablue whale traveled 3112 miles in 214hours. what was the whale's rate in yards per hour? (1 mile = 1,760 yards)
Answers: 1
You know the right answer?
The graph below shows a company's profit f(x), in dollars, depending on the price of pencils x, in d...
Questions in other subjects:


English, 18.08.2021 23:20
Mathematics, 18.08.2021 23:20
Mathematics, 18.08.2021 23:20

Social Studies, 18.08.2021 23:20
Social Studies, 18.08.2021 23:20


