
Mathematics, 24.04.2020 19:43 mallorybranham
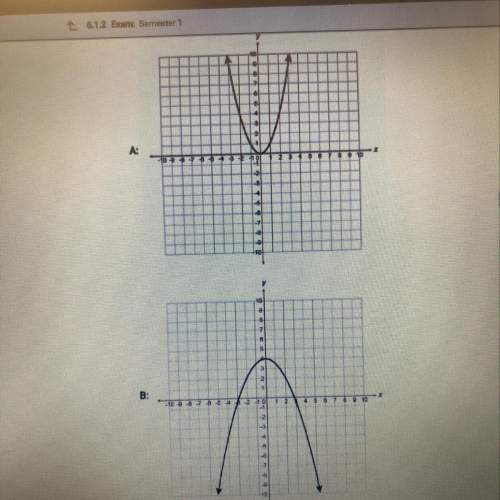
The graph below shows a company's profit f(x), in dollars, depending on the price of erasers x, in dollars, sold by the company:
Part A: What do the x-intercepts and maximum value of the graph represent? What are the intervals where the function is increasing and decreasing, and what do they represent about the sale and profit? (4 points)
Part B: What is an approximate average rate of change of the graph from x = 1 to x = 4, and what does this rate represent? (3 points)
Part C: Describe the constraints of the domain. (3 points)

Answers: 1


Other questions on the subject: Mathematics
Mathematics, 21.06.2019 17:10, makaylashrout77
Which of the following expressions is equal to 2x^2+8
Answers: 2
You know the right answer?
The graph below shows a company's profit f(x), in dollars, depending on the price of erasers x, in d...
Questions in other subjects:

History, 25.07.2019 10:00

Health, 25.07.2019 10:00
Mathematics, 25.07.2019 10:00

Mathematics, 25.07.2019 10:00
Health, 25.07.2019 10:00


