
Mathematics, 24.04.2020 18:00 cdvazquez727
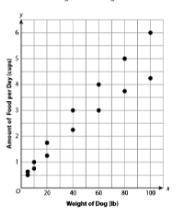
1) The scatter plot below represents the amount of dog food brand recommends based on the weight of the dog. Which best describes the type of association shown in this scatter plot? A. No Association B. Nonlinear association C. Positive Linear Association D. Negative Linear Association.
2) Which pairs of variables would most likely have a positive association?
Choose all that apply.
A. The age of a kitten and its weight
B. Temperature and sales of mittens
C. Temperature and sales of ice cream
D. The height of students and their scores on a test
E. The number of notebooks brought and the total cost
F. The amount of time walking home and the current distance from home
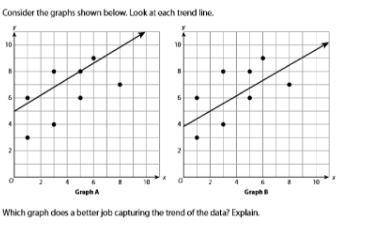
3) Consider the graphs shown below. Look at each trend line.
Which graph does a better job capturing the trend of data? Explain.
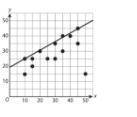
4) Bridget drew the trend line shown in the following scatter plot.
Which statement best explains whether the trend line is a good fit for the data?
A. The trend is not a good fit for the data because there is an outlier
B. The trend line is not good fit for the data because most of the data points are below the trend line
C. The trend line is a good for the data because it passes through two of the data points
D. The trend line is a good fit for the data because the data represent a positive association, and the line has a positive slope.
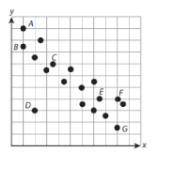
5) Through which pairs of points could a trend line be drawn that represents the data?
Choose all that apply.
A. Points A and F
B. Points B and E
C. Points B and G
D. Points C and E
E. Points D and G
F. Points E and G

Answers: 1


Other questions on the subject: Mathematics
Mathematics, 21.06.2019 21:10, ttrinityelyse17
The table below shows the approximate height of an object x seconds after the object was dropped. the function h(x)= -16x^2 +100 models the data in the table. for which value of x would this model make it the least sense to use? a. -2.75 b. 0.25 c. 1.75 d. 2.25
Answers: 2
Mathematics, 21.06.2019 23:30, paolaf3475
Without multiplying, tell which product is larger and why. 5 × 1/3 or 5 × 2/3 a)5 × 1/3 because 1/3 is less than 2/3 b) 5 × 1/3 because 1/3 is greater than 2/3 c) 5 × 2/3 because 1/3 is less than 23 d) 5 × 23 because 1/3 is greater than 2/3
Answers: 1
Mathematics, 22.06.2019 01:00, chrischris1
The answer is 7.2 how would you put this as money
Answers: 2
You know the right answer?
1) The scatter plot below represents the amount of dog food brand recommends based on the weight of...
Questions in other subjects:
Mathematics, 16.12.2020 20:40

Biology, 16.12.2020 20:40
Mathematics, 16.12.2020 20:40

Mathematics, 16.12.2020 20:40


