
Mathematics, 24.04.2020 17:27 illl6266
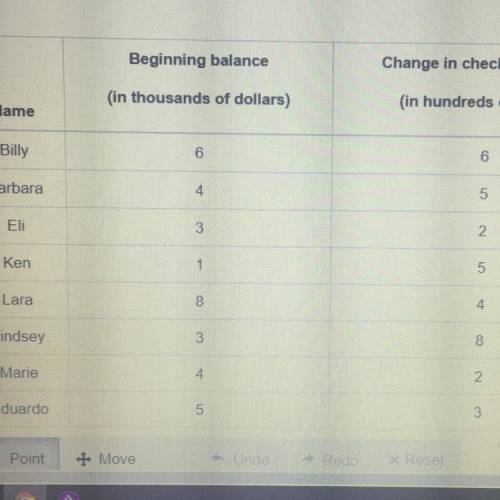
Eight people were asked what the balance of their checking account at the beginning of this past
week was and how much it increased or decreased by the end of the week.
Create a scatter plot that represents the data that is shown in the table. The x-axis represents the
beginning balance in thousands of dollars and the y-axis represents the change in the checking
account in hundreds of dollars.

Answers: 1


Other questions on the subject: Mathematics
You know the right answer?
Eight people were asked what the balance of their checking account at the beginning of this past
Questions in other subjects:

Chemistry, 10.06.2020 23:57

History, 10.06.2020 23:57


Spanish, 10.06.2020 23:57
Mathematics, 10.06.2020 23:57

Geography, 10.06.2020 23:57

Mathematics, 10.06.2020 23:57


