Price
200
Month
Which graph appears to show the best performance? Which scale make...

Mathematics, 24.04.2020 08:00 alexandrecarmene
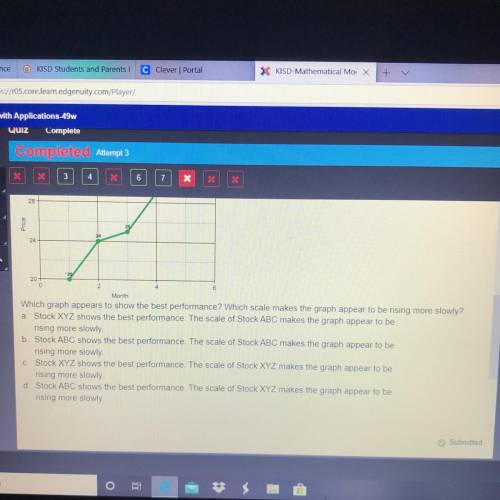
Price
200
Month
Which graph appears to show the best performance? Which scale makes the graph appear to be rising more slowly?
a. Stock XYZ shows the best performance. The scale of Stock ABC makes the graph appear to be
rising more slowly
b. Stock ABC shows the best performance. The scale of Stock ABC makes the graph appear to be
rising more slowly
C. Stock XYZ shows the best performance. The scale of Stock XYZ makes the graph appear to be
rising more slowly
d Stock ABC shows the best performance. The scale of Stock XYZ makes the graph appear to be
rising more slowly

Answers: 2


Other questions on the subject: Mathematics
Mathematics, 20.06.2019 18:04, ashleypaz15
Students buying lunch at rockwell elementary school yesterday chose either burritos or pizza. 185 students chose burritos and 252 chose pizza. 1. estimate the number of students who brought lunch by rounding each number to the nearest hundred. 2. estimate how many students bought lunch by rounding each number to the nearest ten. 3. find the total number of students who brought lunch. which of your estimates is closer to the actual total? explain. 4. draw a figure on a sheet of paper. estimate how many pennies will fit inside the figure. check your prediction using pennies.
Answers: 1
Mathematics, 21.06.2019 14:50, hiihihihij
Do 12/14 and 8/10 have the same value? explain your answer.
Answers: 1
Mathematics, 21.06.2019 17:00, drandbone92
Shane can shovel the driveway in 4 hours, but if his sister it would take 2 hours. how long would it take taylor to shovel the driveway alone
Answers: 1
You know the right answer?
Questions in other subjects:


History, 18.08.2019 23:10

Chemistry, 18.08.2019 23:10


Physics, 18.08.2019 23:10

Mathematics, 18.08.2019 23:10


