
Mathematics, 23.04.2020 21:58 alissa64
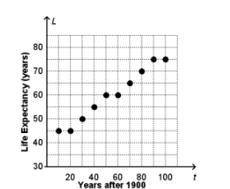
The scatter plot shows the relationship between the time t, in years after 1900, and the life expectancy, in years, at birth for a certain country.
Which of the following statements best describes the data on the scatter plot?
A. The data on the scatterplot suggests a linear association that could be modeled by the function
L(t) = 39.67t + 0.37.
B. The data on the scatterplot suggests a linear association that could be modeled by the function
L(t) = -0.24t + 74.33.
C. The data on the scatterplot suggests a linear association that could be modeled by the function
L(t) = 0.37t + 39.67.
D. The data on the scatter plot does not suggest a linear association, so it cannot be modeled by a linear
function.

Answers: 2


Other questions on the subject: Mathematics
Mathematics, 21.06.2019 19:00, alkaline27
Amodel rocket is launched from a roof into a large field. the path of the rocket can be modeled by the equation y = -0.04x^2 + 8.6x + 4.8, where x is the horizontal distance, in meters, from the starting point on the roof and y is the height, in meters, of the rocket above the ground. how far horizontally from its starting point will the rocket land? a. 0.56 m b. 215.56 m c. 431.11 m d. 215.74 m
Answers: 1
Mathematics, 22.06.2019 01:30, Queenempress9380
A23 – year – old male buys 100/300/100 liability insurance, collision insurance with a $100 deductible, and comprehensive insurance with a $250 deductible? what is his total annual premium? (a) $1142.00 (b) $1765.45 (c) $1770.10 (d) $1785.25
Answers: 2
You know the right answer?
The scatter plot shows the relationship between the time t, in years after 1900, and the life expect...
Questions in other subjects:


History, 31.07.2019 18:00

History, 31.07.2019 18:00
Mathematics, 31.07.2019 18:00
History, 31.07.2019 18:00
History, 31.07.2019 18:00


