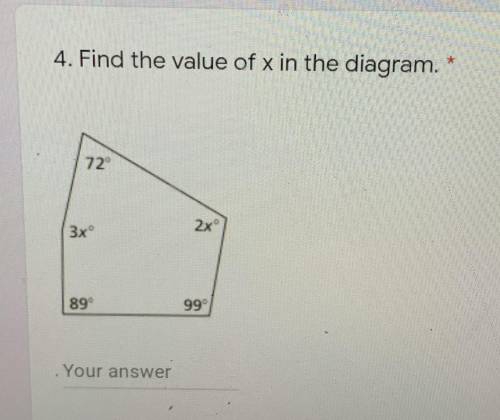
Find the value of X in the diagram
...

Mathematics, 23.04.2020 05:19 iwannabewinston
Find the value of X in the diagram

Answers: 1


Other questions on the subject: Mathematics
Mathematics, 21.06.2019 18:30, 2024daisjavien
For this option, you will work individually. the pythagorean theorem can be used in many real-world scenarios. part 1 write your own real-world scenario where the pythagorean theorem can be applied to find a missing piece. you may choose to write a problem that is two- or three-dimensional in nature. be sure that you will be able to draw a diagram of your scenario. write out your problem and submit it for part 1. be sure to end your scenario with a question. part 2 draw a diagram of the scenario you created in part 1. you may draw by hand and scan and upload your drawing or create a computer-generated drawing for submission. be sure to label all parts and dimensions of the drawing. part 3 solve the question that you posed in part 1. show all of your steps in answering the question. for this option, you will need to submit all three parts for full credit—your real-world problem and question, the diagram that you created, and your work solving the problem, showing all steps. * note that your instructor is looking for your own original idea. while it is acceptable to use the internet for research and inspiration, academic integrity policies apply.
Answers: 1
Mathematics, 21.06.2019 20:00, zgueyeu
The two cylinders are similar. if the ratio of their surface areas is 9/1.44 find the volume of each cylinder. round your answer to the nearest hundredth. a. small cylinder: 152.00 m3 large cylinder: 950.02 m3 b. small cylinder: 972.14 m3 large cylinder: 12,924.24 m3 c. small cylinder: 851.22 m3 large cylinder: 13,300.25 m3 d. small cylinder: 682.95 m3 large cylinder: 13,539.68 m3
Answers: 2
Mathematics, 21.06.2019 20:00, gordon57
Someone answer asap for ! max recorded the heights of 500 male humans. he found that the heights were normally distributed around a mean of 177 centimeters. which statements about max’s data must be true? a. the median of max’s data is 250 b. more than half of the data points max recorded were 177 centimeters. c. a data point chosen at random is as likely to be above the mean as it is to be below the mean. d. every height within three standard deviations of the mean is equally likely to be chosen if a data point is selected at random.
Answers: 1
Mathematics, 21.06.2019 20:30, erikloza12pdidtx
Jose is going to use a random number generator 500500 times. each time he uses it, he will get a 1, 2, 3,1,2,3, or 44.
Answers: 1
You know the right answer?
Questions in other subjects:

Mathematics, 31.08.2019 20:50
Mathematics, 31.08.2019 20:50

History, 31.08.2019 20:50
Mathematics, 31.08.2019 20:50
History, 31.08.2019 20:50
History, 31.08.2019 20:50


