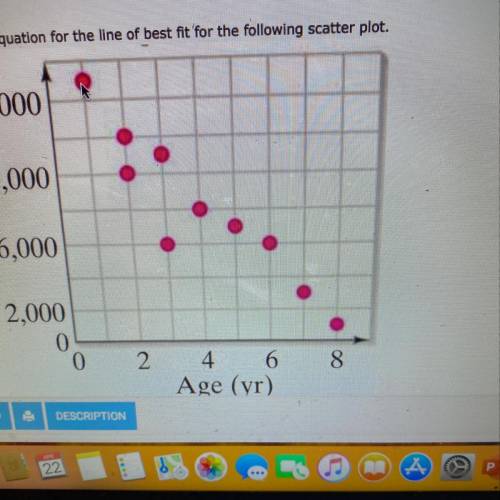
Estimate an equation for the line of best fit for the following scatter plot.
...

Mathematics, 23.04.2020 04:52 lizerator01
Estimate an equation for the line of best fit for the following scatter plot.

Answers: 2


Other questions on the subject: Mathematics
Mathematics, 21.06.2019 16:20, tmantooth7018
The lengths of nails produced in a factory are normally distributed with a mean of 4.91 centimeters and a standard deviation of 0.05 centimeters. find the two lengths that separate the top 4% and the bottom 4%. these lengths could serve as limits used to identify which nails should be rejected. round your answer to the nearest hundredth, if necessary.
Answers: 3
Mathematics, 21.06.2019 18:30, genyjoannerubiera
Isuck at math ; ^; m a student solved this problem and said the answer is 3 feet. chase had a roll of ribbon that contained 7 7/8 feet of ribbon. he cut off one piece that was 3 5/8 feet long and another piece that was 1 1/4 feet from the roll. how much ribbon was left on the roll? is the student's answer reasonable? yes, the answer is reasonable. no, the answer is not reasonable. it should be about 2 feet. no, the answer is not reasonable. it should be about 13 feet. no, the answer is not reasonable. it should be about 4 feet.
Answers: 1
Mathematics, 21.06.2019 23:30, cranfordjacori
Ateam of runners is needed to run a 1 2 -mile relay race. if each runner must run 1 4 mile, how many runners will be needed?
Answers: 3
Mathematics, 21.06.2019 23:50, obrunelle4678
Solve for x in the equation x2 - 12x + 36 = 90. x= 6+3x/10 x=6+2/7 x= 12+3/22 x = 12+3/10
Answers: 2
You know the right answer?
Questions in other subjects:

History, 04.04.2020 01:57


English, 04.04.2020 01:57


