Both parts use the same picture.
Part A
Which measure of center would you us...

Mathematics, 22.04.2020 23:52 brittanyrenner6657
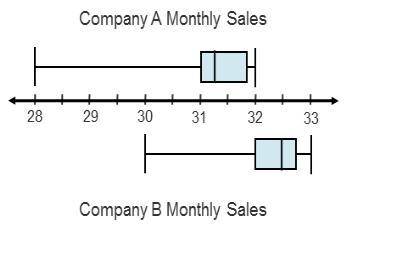
Both parts use the same picture.
Part A
Which measure of center would you use to compare the populations represented by the box plots?
A. median
B. mean
C. mean absolution deviation (MAD)
D. interquartile range (IQR)
Part B
Which measure of variability would you use to compare the populations represented by the box plots?
A. median
B. mean
C. mean absolution deviation (MAD)
D. interquartile range (IQR)

Answers: 2


Other questions on the subject: Mathematics
Mathematics, 21.06.2019 14:00, mariah9695
Module 10 coordinate proof using slope and distance answers is quadrilateral abcd a parallelogram? explain how you know.
Answers: 1
Mathematics, 21.06.2019 18:30, joaquin42
Which of the statements about the graph of the function y = 2x are true? check all of the boxes that apply. the domain is all real numbers x because the exponent of 2 can be any real number when the x-values increases by 1 unit, the y-value multiplies by 2. the y-intercept is (0, 1). the graph never goes below the x-axis because powers of 2 are never negative. the range is all real numbers.
Answers: 1
Mathematics, 21.06.2019 21:00, cwebb4383
The sum of the first eight terms of an arithmetic progression is 9m + 14. the fifth term of the06 progression is 2m - 6, where m is a constant. given that the first term of the progression is 26,find the value of the common difference, d and thevalue of m.
Answers: 1
You know the right answer?
Questions in other subjects:
Mathematics, 19.10.2021 16:50

Mathematics, 19.10.2021 16:50

Chemistry, 19.10.2021 16:50
Mathematics, 19.10.2021 17:00

History, 19.10.2021 17:00
Chemistry, 19.10.2021 17:00


