
Mathematics, 22.04.2020 22:29 awdadaddda
These box plots represent the number of seconds that a random sample of 100 traffic lights are red in each of two cities: Johnstown and Martinville

Answers: 2
 times the range of the data shown for Johnstown,and about
  times the range of data for Martinville. (D)
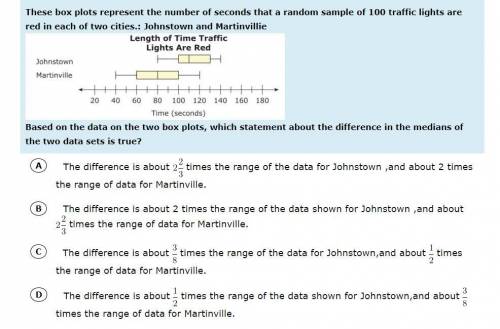


Other questions on the subject: Mathematics
Mathematics, 21.06.2019 17:30, apexdude2020
The swimming pool is open when the high temperature is higher than 20∘c. lainey tried to swim on monday and thursday (which was 33 days later). the pool was open on monday, but it was closed on thursday. the high temperature was 30 ∘c on monday, but decreased at a constant rate in the next 33 days. write an inequality to determine the rate of temperature decrease in degrees celsius per day, d, from monday to thursday.
Answers: 3
Mathematics, 21.06.2019 18:00, xojade
Assume that the weights of quarters are normally distributed with a mean of 5.67 g and a standard deviation 0.070 g. a vending machine will only accept coins weighing between 5.48 g and 5.82 g. what percentage of legal quarters will be rejected? round your answer to two decimal places.
Answers: 1
You know the right answer?
These box plots represent the number of seconds that a random sample of 100 traffic lights are red i...
Questions in other subjects:

Chemistry, 28.05.2021 06:50

Mathematics, 28.05.2021 06:50
Mathematics, 28.05.2021 06:50
Mathematics, 28.05.2021 06:50
Mathematics, 28.05.2021 06:50


