
Mathematics, 22.04.2020 23:15 lukeperry
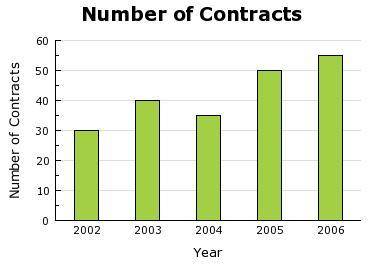
The bar graph shows the number of contracts Company X gained each year from 2002 to 2006. Over which of the periods was the average rate of increase for number of Contracts for Company X the smallest?
A) From 2002 through 2003
B) From 2002 through 2004
C) From 2004 through 2005
D) From 2004 through 2006

Answers: 3


Other questions on the subject: Mathematics
Mathematics, 21.06.2019 23:30, zimbabwayjerry
Written as a simplified polynomial in standard form, what is the result when (2x+8)^2(2x+8) 2 is subtracted from 8x^2-38x 2 −3?
Answers: 3
Mathematics, 22.06.2019 00:40, seiglersteven99
Ican interpret and represent the remainder in division calculations sensibly for the context (eg 27.4 in calculating average height in cm: $27.44 if it represents an amount of money) solve the following problems. 15) the wildlife park charges $25.50 dollars per person to enter their park if the park made $15096 dollars today, how many people entered the park? 16) ms adams plus 2,230 other keen runners ran a marathon: between them they ran 94817.5km. how many km did each competitor run?
Answers: 1
You know the right answer?
The bar graph shows the number of contracts Company X gained each year from 2002 to 2006. Over which...
Questions in other subjects:

Biology, 01.11.2019 14:31
Mathematics, 01.11.2019 14:31


Biology, 01.11.2019 14:31
History, 01.11.2019 14:31

Chemistry, 01.11.2019 14:31
History, 01.11.2019 14:31


