A small class took a survey of the number of siblings
each student has. The data are shown in...

Mathematics, 22.04.2020 17:25 jay13212
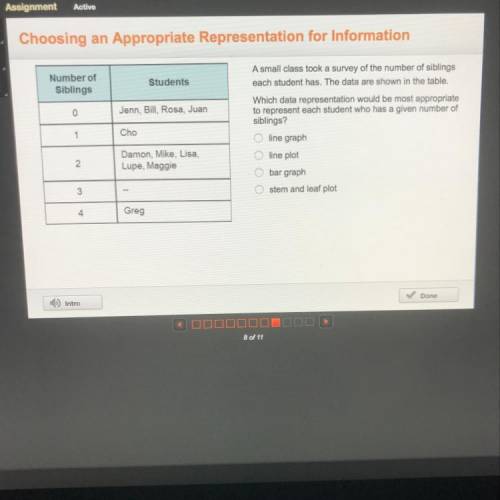
A small class took a survey of the number of siblings
each student has. The data are shown in the table.
Which data representation would be most appropriate
to represent each student who has a given number of
siblings?
line graph
line plot
bar graph
stem and leaf plot

Answers: 2


Other questions on the subject: Mathematics
Mathematics, 22.06.2019 00:30, PollyB1896
Which is an x-intercept of the graphed function? (0, 4) (–1, 0) (4, 0) (0, –1)
Answers: 2
Mathematics, 22.06.2019 05:00, gildedav001
Rosa and lisa ade practicing free throws on the basketball court. so far, rosa has made one-and a-half times as many free throws as lisa. what is the unit ratio of rosa's free throws to lisa's free throws?
Answers: 1
Mathematics, 22.06.2019 06:40, tiannahines810
What is the positive solution to the equation 0 = -x2 + 2x + 12quadratic formula: x = -b/b²-4ac0-2+5202-20 ite10-1+2
Answers: 2
You know the right answer?
Questions in other subjects:
Mathematics, 09.09.2020 07:01

Chemistry, 09.09.2020 07:01
Mathematics, 09.09.2020 07:01

English, 09.09.2020 07:01
Mathematics, 09.09.2020 07:01
Mathematics, 09.09.2020 07:01
Mathematics, 09.09.2020 07:01

Biology, 09.09.2020 07:01
Mathematics, 09.09.2020 07:01
Mathematics, 09.09.2020 07:01


