
Mathematics, 22.04.2020 03:25 mcmccann4317
A yearbook company was investigating whether there is a significant difference between two states in the percents of high school students who order yearbooks. From a random sample of 150 students selected from one state, 70 had ordered a yearbook. From a random sample of 100 students selected from the other state, 65 had ordered a yearbook. Which of the following is the most appropriate method for analyzing the results?A. A one-sample zz-test for a sample proportionB. A one-sample zz-test for a population proportionC. A two-sample zz-test for a difference in sample proportionsD. A two-sample zz-test for a difference in population proportionsE. A two-sample zz-test for a population proportion

Answers: 3


Other questions on the subject: Mathematics
Mathematics, 21.06.2019 17:30, rjsimpson73
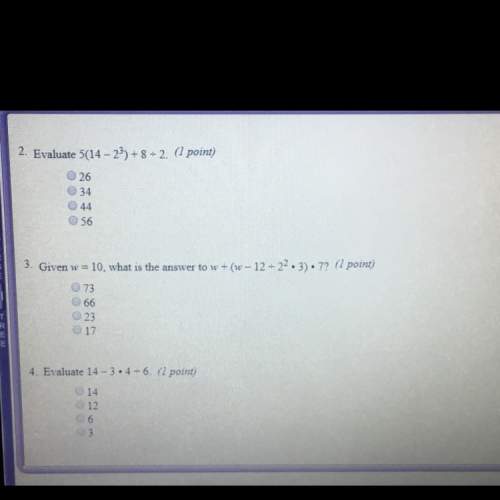
Ined this is due tomorrow and i dont know the answer can you find all the exponents
Answers: 1
Mathematics, 21.06.2019 18:50, firenation18
The table represents a function. what is f(-2)? a.-3 b. -1 c.1 d.3
Answers: 1
Mathematics, 21.06.2019 19:00, lexipooh7894
What are the solutions of the system? y = x^2 + 2x +3y = 4x - 2a. (-1, -6) and (-3, -14)b. (-1, 10) and (3, -6)c. no solutiond. (-1, -6) and (3, 10)
Answers: 1
You know the right answer?
A yearbook company was investigating whether there is a significant difference between two states in...
Questions in other subjects:

History, 05.10.2019 23:00

Mathematics, 05.10.2019 23:00

Biology, 05.10.2019 23:00


Social Studies, 05.10.2019 23:00


