
Mathematics, 27.08.2019 13:30 suselygonza
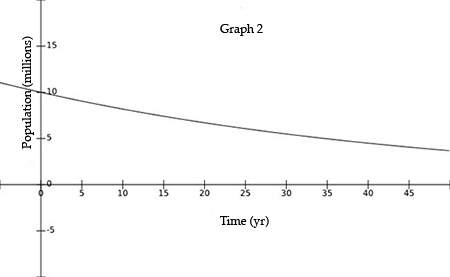
The future population of a small south american country of 10 million people can be modeled by the exponential equation p(t) = p0(e)0.02t, where p(t) is the future population in t years and p0 is the current population in millions of people.
which of the following graphs represents this model, what is the expected population of this country (rounded to the nearest tenth of a million) in 40 years, and how long will it take (rounded to the nearest year) for the current population to reach 30 million?
graph 1, 21.7 million, 50 years
graph 2, 4.9 million, 30 years
graph 2, 4.5 million, the population will not reach 30 million because this graph is an exponential decay model
graph 1, 22.3 million, 55 years


Answers: 1


Other questions on the subject: Mathematics
Mathematics, 21.06.2019 23:00, jnsoccerboy7260
The perimeter of a rectangular rug is 24 feet. the length of the rug is 1 2/5 i s width. what is the area of the rug
Answers: 2
You know the right answer?
The future population of a small south american country of 10 million people can be modeled by the e...
Questions in other subjects:


Business, 04.11.2019 22:31


