
Mathematics, 22.04.2020 01:17 edailey4448
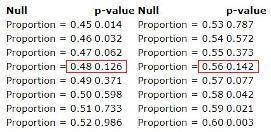
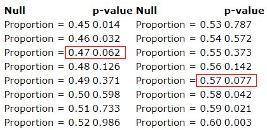
Suppose we are constructing a confidence interval using repeated tests of significance to develop an interval of plausible values. Using two-sided tests each time with the following null hypotheses, we obtain the resulting p-values.
Null p-value Null p-value
Proportion = 0.45 0.014 Proportion = 0.53 0.787
Proportion = 0.46 0.032 Proportion = 0.54 0.572
Proportion = 0.47 0.062 Proportion = 0.55 0.373
Proportion = 0.48 0.126 Proportion = 0.56 0.142
Proportion = 0.49 0.371 Proportion = 0.57 0.077
Proportion = 0.50 0.598 Proportion = 0.58 0.042
Proportion = 0.51 0.733 Proportion = 0.59 0.021
Proportion = 0.52 0.986 Proportion = 0.60 0.003
Using the results from the table, give a 90% confidence interval.
Using the results from the table, give a 95% confidence interval.

Answers: 2


Other questions on the subject: Mathematics
Mathematics, 21.06.2019 15:50, AaronMicrosoft15
If you shift the linear parent function, f(x)=x, up 13 units, what is the equation of the new function?
Answers: 1
Mathematics, 21.06.2019 17:00, charitysamuels
Can someone pls ! pls answer all. no explanation needed..
Answers: 1
Mathematics, 21.06.2019 18:30, jeffreyaxtell4542
10% of 1,900,000. show me how you got the answer
Answers: 2
Mathematics, 21.06.2019 19:30, sotoamerica0814
What is the effect on the graph of the function f(x)=x when f(x) is replaced with -f(x)+4
Answers: 1
You know the right answer?
Suppose we are constructing a confidence interval using repeated tests of significance to develop an...
Questions in other subjects:

Mathematics, 22.07.2020 14:01

English, 22.07.2020 14:01

Mathematics, 22.07.2020 14:01
Mathematics, 22.07.2020 14:01
English, 22.07.2020 14:01
Mathematics, 22.07.2020 14:01

Chemistry, 22.07.2020 14:01


