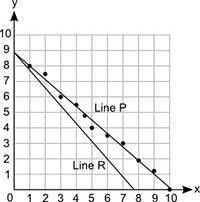
Ted and Meg have each drawn a line on the scatter plot shown below:
Which line best represents...

Mathematics, 21.04.2020 22:11 softballlover487
Ted and Meg have each drawn a line on the scatter plot shown below:
Which line best represents the line of best fit?
Line P, because it is closest to most data points
Line P, because it shows a positive association
Line R, because it is closest to most data points
Line R, because it shows a negative association

Answers: 2


Other questions on the subject: Mathematics
Mathematics, 21.06.2019 18:00, sophiamoser
Julius sold five times as many computers as sam sold last year. in total, they sold 78 computers. how many computers did julius sell?
Answers: 1
Mathematics, 21.06.2019 19:30, iicekingmann
Is the power produced directly proportional to the wind speed, give reasons for your answer?
Answers: 1
Mathematics, 21.06.2019 21:30, shymitch32
Create a graph for the demand for starfish using the following data table: quantity/price of starfish quantity (x axis) of starfish in dozens price (y axis) of starfish per dozen 0 8 2 6 3 5 5 2 7 1 9 0 is the relationship between the price of starfish and the quantity demanded inverse or direct? why? how many dozens of starfish are demanded at a price of five? calculate the slope of the line between the prices of 6 (quantity of 2) and 1 (quantity of 7) per dozen. describe the line when there is a direct relationship between price and quantity.
Answers: 3
Mathematics, 22.06.2019 04:00, pizzacrust1633
A. 120 degrees b. 90 degrees c. 30 degrees d. 60 degrees
Answers: 1
You know the right answer?
Questions in other subjects:
Mathematics, 24.11.2021 14:00
Mathematics, 24.11.2021 14:00


Mathematics, 24.11.2021 14:00
Business, 24.11.2021 14:00


