
Mathematics, 21.04.2020 20:47 duyphan
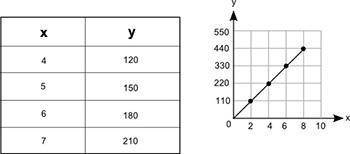
The table and the graph below each show a different relationship between the same two variables, x and y:
How much more would the value of y be on the graph than its value in the table when x = 12?
150
300
450
600

Answers: 2


Other questions on the subject: Mathematics
Mathematics, 21.06.2019 15:30, hannahking1869
Which conjunction is disjunction is equivalent to the given absolute value inequality? |x+2|< 18
Answers: 1
Mathematics, 21.06.2019 21:30, lilbit217
The map shows the location of the airport and a warehouse in a city. though not displayed on the map, there is also a factory 112 miles due north of the warehouse. a truck traveled from the warehouse to the airport and then to the factory. what is the total number of miles the truck traveled?
Answers: 3
Mathematics, 21.06.2019 23:30, abell23000
Afriend of mine is giving a dinner party. his current wine supply includes 10 bottles of zinfandel, 8 of merlot, and 11 of cabernet (he only drinks red wine), all from different wineries. (a) if he wants to serve 3 bottles of zinfandel and serving order is important, how many ways are there to do this? ways (b) if 6 bottles of wine are to be randomly selected from the 29 for serving, how many ways are there to do this? ways (c) if 6 bottles are randomly selected, how many ways are there to obtain two bottles of each variety? ways (d) if 6 bottles are randomly selected, what is the probability that this results in two bottles of each variety being chosen? (round your answer to three decimal places.) (e) if 6 bottles are randomly selected, what is the probability that all of them are the same variety? (round your answer to three decimal places.)
Answers: 3
You know the right answer?
The table and the graph below each show a different relationship between the same two variables, x a...
Questions in other subjects:
Mathematics, 01.10.2019 02:30


Physics, 01.10.2019 02:30

Business, 01.10.2019 02:30

Biology, 01.10.2019 02:30


