
Mathematics, 21.04.2020 14:25 cheergirl2133
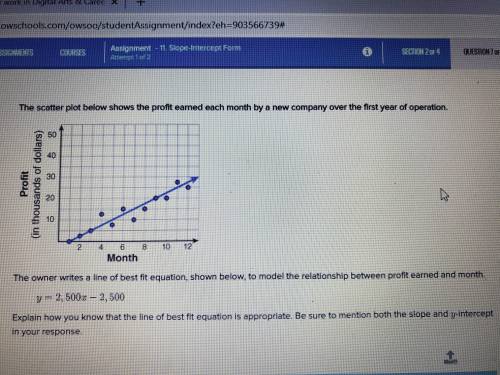
The scatterplot below shows the profit earned each one by a new company over the first year of operation. The owner writes a line of best fit equation, shown below, to model the relationship between profit earned in month.
Y =2,500 X -2,500
explain how you know that the line of best fit equation is appropriate. Be sure to mention about the slope and Y – intercept in your response

Answers: 2


Other questions on the subject: Mathematics
Mathematics, 21.06.2019 17:30, AzuraSchaufler
The graph below represents the number of dolphins in a dolphin sanctuary. select all the key features of this function.
Answers: 2
Mathematics, 21.06.2019 20:20, oofoofoof1
Sample response: if the graph passes the horizontaline test, then the function is one to one. functions that are one to one have inverses that a therefore, the inverse is a hinction compare your response to the sample response above. what did you include in your explanation? a reference to the horizontal-line test d a statement that the function is one-to-one the conclusion that the inverse is a function done
Answers: 2
You know the right answer?
The scatterplot below shows the profit earned each one by a new company over the first year of opera...
Questions in other subjects:


Computers and Technology, 29.01.2022 08:50

Engineering, 29.01.2022 08:50


