
Mathematics, 21.04.2020 04:27 Kennedy3449
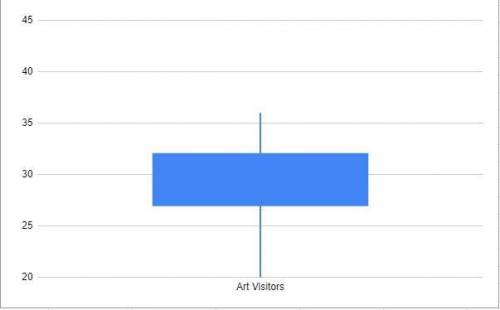
A box plot is shown below: A box and whisker plot is shown using a number line from 20 to 45 with primary markings and labels at 20, 25, 30, 35, 40, 45. In between two primary markings are 4 secondary markings. The box extends from 27 to 38 on the number line. A line in the box is at 32. The whiskers end at 20 and 42. The title of the art is Visitors at the Exhibition, and below the line is written Number of Visitors. What is the median and Q1 of the data set represented on the plot?
Median = 30; Q1 = 27
Median = 32; Q1 = 27
Median = 30; Q1 = 20
Median = 32; Q1 = 20

Answers: 2


Other questions on the subject: Mathematics
Mathematics, 20.06.2019 18:04, peralesdavid34
Find the surface area of the prism formed by the net
Answers: 3
Mathematics, 21.06.2019 17:00, datgamer13
Why did the ice arena get so hot after the big game (this is math related google it to find the paper
Answers: 2
Mathematics, 21.06.2019 23:00, nails4life324
Which of the following scenarios demonstrates an exponential decay
Answers: 1
Mathematics, 21.06.2019 23:30, huneymarie
What are the coordinates of the image of p for a dilation with center (0, 0) and scale factor 2
Answers: 1
You know the right answer?
A box plot is shown below: A box and whisker plot is shown using a number line from 20 to 45 with pr...
Questions in other subjects:


English, 31.03.2020 03:23

History, 31.03.2020 03:23

Chemistry, 31.03.2020 03:23


