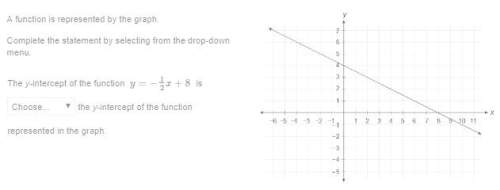
Which system of linear inequalities is represented by the
graph?
y > X-2 and y < x +...

Mathematics, 20.04.2020 20:00 katie6097
Which system of linear inequalities is represented by the
graph?
y > X-2 and y < x + 1
y<X-2 and y > x + 1
y ex-2 and y > x + 1
y > x-2 and y < x + 1

Answers: 3


Other questions on the subject: Mathematics
Mathematics, 21.06.2019 23:30, JellalFernandes
Atruck can be rented from company a $50 a day plus $0.60 per mile. company b charges $20 a day plus $0.80 per mile to rent the same truck. find the number of miles in a day at which the rental costs for company a and company b are the same
Answers: 1
Mathematics, 22.06.2019 01:30, ginareyes0423
Awoman who is 64 inches with a shoulder width of 16 inches. write an equation relating the height h to the width w. find the height of a woman who has ashoulder width of 18.5 inches
Answers: 3
Mathematics, 22.06.2019 04:50, anna2894
Use the information given below, to compare the cost of operating two different vehicles for one month (4 weeks) you are considering two different cars. you drive to work, a 20 mile round trip, five days a week. gasoline costs you $1.50 per gallon car agets 28 miles per gallon, would have $300 a year in maintenance costs, and would cost you $1,500 per year to insure car b gets 19 miles per gallon, would have $500 a year in maintenance costs, and would cost you $1,000 per year to insure costs car a car b gas cost per month insurance cost per month maintenance cost per month $ total cost per month
Answers: 1
Mathematics, 22.06.2019 05:30, babysune01
Multiple questions for same graphwhat is the range of the set of data this box-and-whisker plot represents? 36810what is the interquartile range of the set of data this box-and-whisker plot represents? 36810
Answers: 1
You know the right answer?
Questions in other subjects:
Mathematics, 11.05.2021 18:00


History, 11.05.2021 18:00

Social Studies, 11.05.2021 18:00


